The History of Healing
 Influenza Pandemics That Changed the World
Uncover the global impact of influenza pandemics and explore the lessons learned from historic flu outbreaks to inform future health strategies.

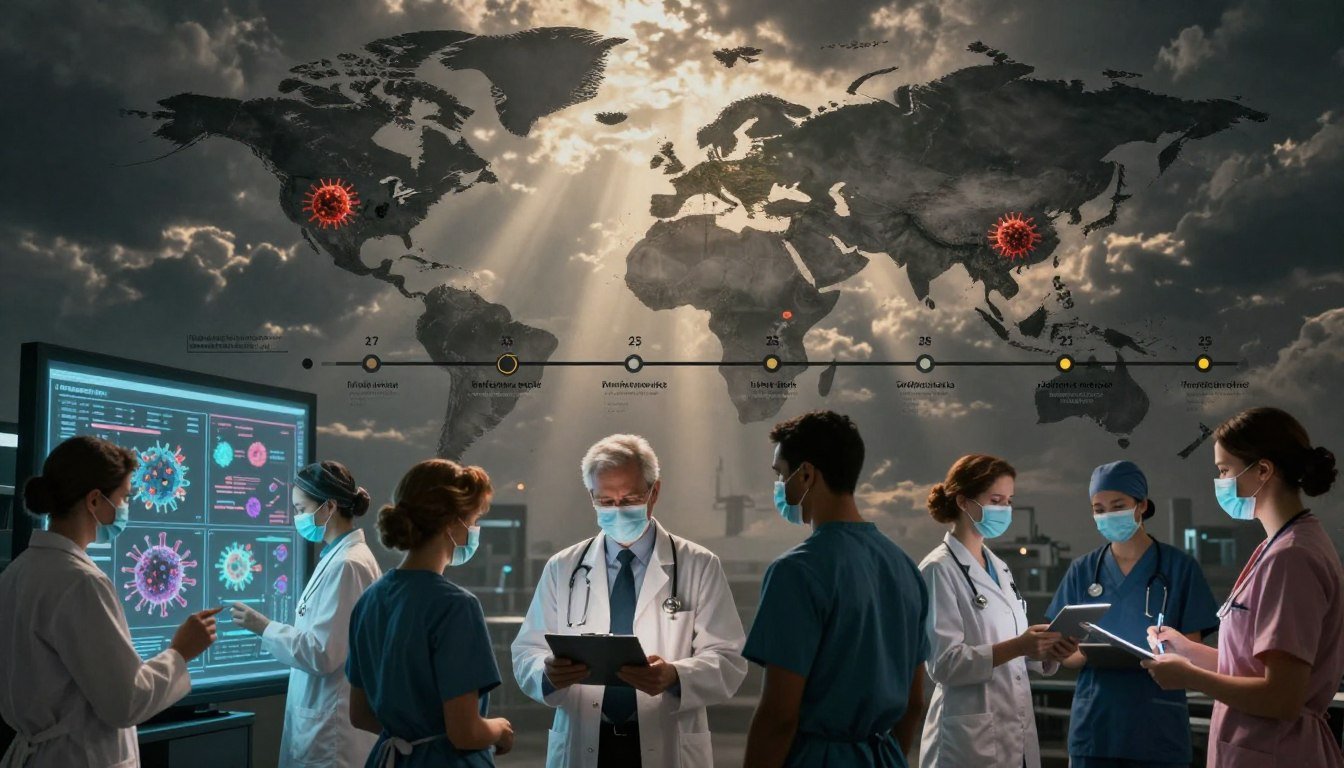
One flu event in 1918 may have killed 50 to 100 million people worldwide. This number shows why the United States plans carefully for future outbreaks.
Influenza, or “the flu,” is a disease that affects birds and mammals. It is caused by RNA viruses in the Orthomyxoviridae family. In people, it can cause fever, sore throat, muscle pain, and more.
It can turn into pneumonia and death, mostly in young children and older adults. The world has seen five major influenza pandemics in about 140 years.
These global health crises don’t follow a set schedule. This uncertainty makes them even more dangerous. Some outbreaks change our daily lives, while others fade quickly.
This series explores how influenza pandemics have changed medicine, policy, and public trust in the United States. We’ll look at key moments in 1918, 1957, 1968, and 2009. We’ll see how vaccines and antivirals have evolved over time.
Key Takeaways
- Influenza Pandemics can cause massive death tolls and lasting social change.
- Influenza is a viral infection that can progress from fever and cough to pneumonia.
- Five major influenza pandemics have occurred in the late 1800s, but timing is irregular.
- Global health crises often expose gaps in healthcare capacity and public messaging.
- Flu outbreaks have driven the rise of vaccines and modern antivirals such as Tamiflu and Relenza.
- Comparing past influenza pandemics helps explain what preparedness looks like today.
Overview of Influenza Pandemics
Influenza pandemics are rare but can spread quickly. At first, they seem like common colds. But soon, cases pop up everywhere.
Definition of Influenza Pandemics
An influenza pandemic is a big outbreak caused by a virus. It spreads across many places and affects lots of people. Unlike regular flu, these outbreaks spread fast and wide.
Causes and Transmission
New strains of the virus come from animals like pigs and chickens. When these strains change, they can spread easily. This is why outbreaks happen suddenly.
The virus spreads through coughs and sneezes. It can also spread through touching infected areas and then touching your face. Birds can spread it too, through their droppings.
| Route or Condition | What spreads the virus | Practical example | Why it matters in epidemiology |
|---|---|---|---|
| Aerosols | Tiny droplets released by coughing or sneezing | Close indoor contact on buses, classrooms, or offices | Supports fast growth of viral infections when ventilation is poor |
| Direct fluid contact | Saliva and nasal secretions | Sharing cups, close caregiving, or wiping a child’s nose | Creates short-range chains that can expand during influenza pandemics |
| Contaminated hands and surfaces | Transfer after touching infected fluids, then eyes/nose/mouth | Door handles, phones, and countertops in busy homes | Helps explain cluster patterns in respiratory illnesses |
| Animal-associated exposure | Contact with infected birds or contaminated droppings | Handling poultry or cleaning areas where birds were kept | Adds spillover risk that can introduce new viral infections |
| Virus persistence | Survival about 1 week at body temperature; over 30 days at 32°F; far longer at very low temperatures | Cold storage conditions can preserve infectious material longer | Affects how investigators interpret timing during influenza pandemics |
| Cleaning and inactivation | Many strains are inactivated by disinfectants and detergents | Routine cleaning reduces contamination on high-touch areas | Shapes guidance meant to limit respiratory illnesses in shared spaces |
Impact on Global Health
Influenza pandemics can come in waves. At first, more people die before health systems get better. The impact changes by age and health status.
Hospitals get overwhelmed with more cases and fewer staff. Schools and work places also shut down. This is why we plan for these outbreaks carefully.
Historical Context of Influenza Pandemics
In the modern era, influenza has caused waves that changed communities and tested health systems. Looking back at these flu outbreaks helps us understand today’s focus on speed, clear data, and public trust. The question in epidemiology is why some waves fade fast while others become major global health crises?
Timeline of Major Pandemics
The 1889–1890 “Russian flu” started modern records, linked to about 1 million deaths in a world of 1.5 billion. Then came the 1918–1920 Spanish flu (H1N1), followed by the 1957–1958 Asian flu (H2N2) and the 1968–1969 Hong Kong flu (H3N2). Later, the 1977 “Russian flu” (H1N1) mainly hit people under 25, and the 2009–2010 H1N1 “swine flu” pandemic followed.
Not every scary season is the same. The 1947 “pseudopandemic” had a big vaccine mismatch but low death rates. The 1976 Fort Dix swine influenza outbreak raised alarms but didn’t become a full pandemic. These events shaped how the United States watches for infectious diseases and prepares for future global health crises.
Comparison of Different Pandemics
| Pandemic (years) | Subtype | Estimated R0 | Infected share (approx.) | Estimated deaths | Case fatality (approx.) | Severity index |
|---|---|---|---|---|---|---|
| Spanish flu (1918–1920) | H1N1 | ~1.80 (IQR 1.47–2.27) | ~33% (≈500 million) to >56% (>1 billion) | ~17–100 million | ~2–3% (higher in some analyses) | 5 |
| Asian flu (1957–1958) | H2N2 | ~1.65 | >17% (>500 million) | ~1–4 million | <0.2% | 2 |
| Hong Kong flu (1968–1969) | H3N2 | ~1.80 | >14% (>500 million) | ~1–4 million | <0.2% | 2 |
| H1N1 “swine flu” (2009–2010) | H1N1 | ~1.46 | ~11–21% (≈0.7–1.4 billion) | ~151,700–575,400 | ~0.01% | 1 |
These contrasts show how global spread can look similar on a map but outcomes differ. In epidemiology, factors like existing immunity, age patterns, and healthcare capacity explain why some flu outbreaks hit harder than others. Even with similar transmission, the burden of infectious diseases can vary sharply between decades.
Lessons from History
- No fixed schedule: major influenza waves do not follow a dependable rhythm, which complicates forecasting for global health crises.
- Different viruses, different rules: true pandemics in 1918, 1957, and 1968 aligned with influenza A subtype shifts (H1N1, H2N2, H3N2), often tied to genetic reassortment with animal influenza A viruses.
- Severity is not guaranteed: high visibility does not always mean high mortality, as seen in events described as “pseudopandemics” or age-restricted surges.
- Better data changes decisions: consistent reporting, lab testing, and clear risk messaging help public health leaders track infectious diseases as conditions evolve.
This history sets a baseline for how people interpret risk today. It also explains why flu planning now treats surveillance, rapid updates, and flexible response plans as core tools in epidemiology, when early signals hint at the next round of global health crises.
The Spanish Flu of 1918
The Spanish flu was a major outbreak from 1918 to 1920. It spread fast and far, hitting even remote places. In the U.S., life changed quickly as people got sick in homes and cities.
Overview of the Pandemic
The first cases were reported on March 11, 1918, at Fort Riley, Kansas. Soon, hundreds of soldiers were sick. This spread quickly across the country and then overseas.
In the U.S., about one-third of the people got sick. There were around 675,000 deaths in 1918 alone. Many cases started like a regular flu but quickly got worse.
People got fever and chills, then their lungs failed. Doctors found lungs full of fluid and dark spots that meant no oxygen.
Social and Economic Impacts
Hospitals were soon full, and there were not enough doctors or supplies. Some places couldn’t bury the dead fast enough. Prices for coffins went up a lot.
Workplaces got emptier, schools closed, and businesses slowed down. Young adults were hit hard, unlike usual. Pregnant women were also very vulnerable.
Public Health Responses
Cities tried to stop the spread by closing schools and businesses. Boston shut schools and bars. Nashville stopped movie houses and church services.
Police in Chicago arrested people who coughed in public. This shows how scared and urgent things were. People used masks in many places.
Drug makers worked on vaccines, but they came too late. Experts say modern drugs like Tamiflu would have helped. This shows how pandemics change how we prepare.
| What communities faced | What it looked like in practice | Why it mattered for respiratory illnesses |
|---|---|---|
| Rapid spread in crowded settings | Fort Riley reports followed by outbreaks across multiple states; troop transport amplified transmission | Showed how close quarters can turn local outbreaks into nationwide public health emergencies |
| Unusual clinical severity | Cases that began with sore throat and fever could progress to lung failure; cyanosis was widely noted | Highlighted how influenza pandemics can overwhelm lungs faster than typical seasonal patterns |
| Medical system strain | Shortages of doctors, hospital rooms, and supplies in the United States | Reduced capacity for basic care and isolation during waves of respiratory illnesses |
| Closures and gathering limits | Boston shut schools and saloons; Nashville prohibited public gatherings and paused services | Aimed to cut transmission when medical tools were limited in public health emergencies |
| Prevention and treatment limits | Vaccine efforts lagged; later analysis pointed to the usefulness of Tamiflu and Relenza for similar strains | Marked the gap between urgent need and available countermeasures during influenza pandemics |
The Asian Flu of 1957
The 1957–1958 Asian flu showed how fast we can react to danger. It moved quickly through travel, schools, and cities. Leaders had to act fast and keep people calm.
Origin and Spread
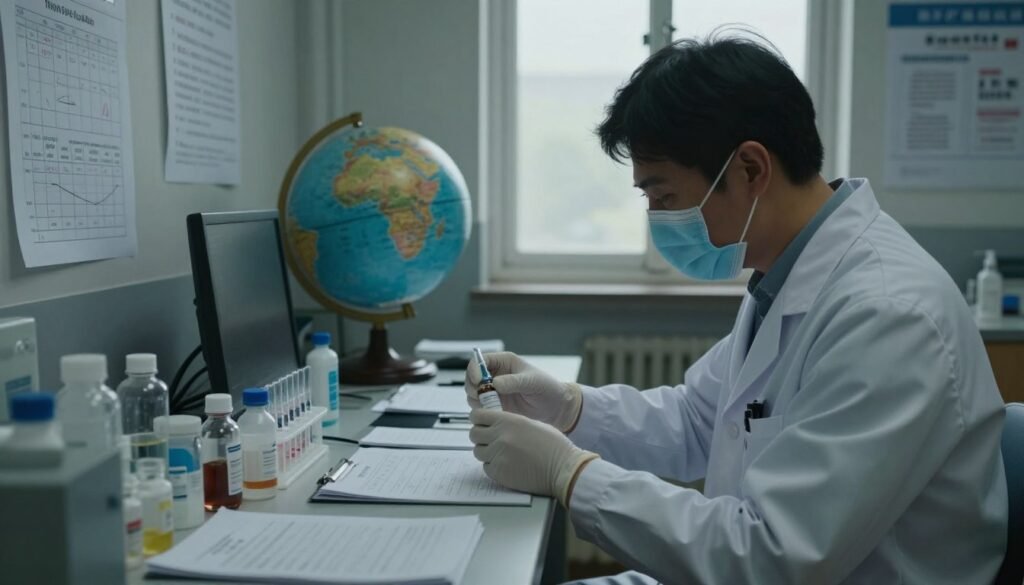
The pandemic started in China in early 1957. It was caused by a new type of flu, A(H2N2). It was first spotted in Guizhou in late February.
By mid-March, it spread across China. Then, it reached Hong Kong in April. The World Health Organization was informed in early May.
By late September, most of the world had been infected. Outbreaks surged when schools reopened in the Northern Hemisphere. This was in October.
Vaccine Development
Scientists quickly identified the virus in the United States, the United Kingdom, and Australia. They found it was unlike earlier strains. This led to the H2N2 subtype label.
Creating a vaccine was a challenge. More doses were needed for a strong response. Evidence showed divided doses worked better than one early shot.
| What was learned | What it meant in 1957–1958 | How it supports pandemic preparedness |
|---|---|---|
| Fast subtype identification (H2N2) | Lab confirmation helped align surveillance as viral infections spread across regions | Earlier matching between circulating strains and vaccine targets, plus clearer risk communication |
| Primary antibody response required more antigen | Many people lacked prior immunity, so dose planning mattered during flu outbreaks | Stockpile and manufacturing plans can account for higher dose needs in a new strain |
| Two-dose schedules often performed better than one early dose | Timing affected protection during the first wave and later rebounds | Guidance can prioritize follow-up dosing when a population is immunologically “new” to a strain |
| Route of administration had limits | Intradermal shots were not a shortcut compared with standard methods at the same dose | Planning can focus on logistics that truly speed coverage, not minor technique changes |
Legacy of the Pandemic
The Asian flu caused 1–4 million deaths worldwide. In the U.S., it’s estimated to have killed 60,000 to 80,000 people. The World Health Organization said it was “uniformly benign” but had serious complications.
Older adults, pregnant women, and those with heart disease were at higher risk. Antibiotics helped reduce deaths from bacterial pneumonia. Yet, some people died from primary influenza pneumonia.
In Latin America, deaths continued into 1959. Chile saw two severe waves. This showed the importance of tracking severe cases during outbreaks.
After the pandemic, H2N2 became endemic. Studies showed repeated infections in school children and medical students. It took about 11 years for H2N2 to disappear and be replaced by H3N2. This taught us to prepare for both the initial outbreak and the long-term effects of flu outbreaks.
The Hong Kong Flu of 1968
In 1968, a new flu wave spread fast across borders and headlines. It turned routine winter illness into a well-known pandemic. For U.S. readers, it shows how global health crises can look different in different places.
Epidemiology teams learned a lot from the 1968–1969 pattern. They saw how timing, travel, and immunity can change what communities face. This knowledge helps plan for infectious diseases today.
Key Characteristics
The Hong Kong flu was caused by influenza A(H3N2). It had a different HA than the earlier H2N2 strain but the same N2 neuraminidase (NA).
This detail was important for epidemiology. It raised a question: could older N2 exposure soften illness, even with a changed HA? This idea helps explain why pandemics can be widespread yet vary in severity.
Western attention first spiked through press reports from Hong Kong. Communication with mainland China was limited. Japan saw early outbreaks that were small and scattered until late 1968.
Impact on Healthcare Systems
Hospitals faced strain mainly from speed and volume. In the United States, introduction on the West Coast was followed by high illness and death rates. This pushed bed capacity, staffing, and supplies.
Parts of Western Europe, including the U.K., saw increased illness in 1968–1969. But death rates didn’t rise until the following year. This pattern is part of public health planning today.
Modern summaries often cite 1–4 million deaths worldwide, with a case fatality under 0.2%. Even so, the experience highlighted how infectious diseases can crowd emergency rooms. It showed the need for better surge planning.
| Region | Early spread pattern (1968–1969) | Mortality signal | What it meant for hospital planning |
|---|---|---|---|
| United States | Rapid growth after West Coast introduction | High illness and death rates during the first wave | Need for fast surge staffing, respiratory care capacity, and flexible triage |
| Japan | Small, scattered outbreaks until late 1968 | Variable by place and time | Harder forecasting; required local monitoring and quick resource shifts |
| Western Europe (including the U.K.) | Widespread illness with uneven timing | Death rates rose more clearly in the following year | Longer-duration pressure; planning for prolonged waves |
Changes It Prompted
The virus fueled research on partial protection tied to NA. In one report, Eickhoff and Meiklejohn found that H2N2 adjuvant vaccination among Air Force cadets reduced later confirmed H3N2 influenza by 54%.
This finding shifted epidemiology toward measuring immunity parts. It showed why vaccine strategy can affect hospital burden during pandemics.
Reports of cross-species transmission added urgency to monitoring animal-human interfaces. These concerns remain key in tracking infectious diseases that could spark future global health crises.
The H1N1 Pandemic of 2009
In 2009, a new H1N1 virus made influenza a global concern. It was first called “swine flu.” But the real story was how quickly it spread. This tested how communities handle flu outbreaks.
Health leaders had to act fast, like in a real-time drill. They showed that pandemic preparedness is not just a plan. It’s about taking action when it counts.
Origins and Spread
The virus was a new H1N1 strain. It had pieces from swine, avian, and human influenza. It spread quickly from person to person, changing early risk estimates.
By early November 2009, WHO updates showed reports from over 206 countries. There were more than 503,000 cases and over 6,250 deaths. Later, it was estimated that many more were infected than reported.
Modern estimates say the virus caused a wide range of deaths. Many say it was milder than the 1918 flu. But it hit some groups hard, like pregnant people and those with chronic conditions. It also made planning for flu season tricky because timing varied by region.
Response Strategies
Public health agencies used the WHO staging framework. This helped them talk about risk in a shared way. It also guided how to communicate with hospitals, schools, and employers.
Doctors used antiviral tools to help high-risk patients. They used oseltamivir (Tamiflu), zanamivir (Relenza), peramivir, and laninamivir. Older agents like amantadine (Symmetrel) and rimantadine (Flumadine) were also used.
Vaccine manufacturing went into emergency mode. Countries used 2009 pandemic vaccines, like Pandemrix. They also used live attenuated influenza vaccines. These efforts showed the trade-offs between speed, coverage, and public confidence.
| Response element | How it worked in 2009 | What it stressed for future planning |
|---|---|---|
| WHO six-stage framework | Phase changes signaled expanding human transmission and guided coordinated messaging across borders. | Clear triggers matter for pandemic preparedness when data arrives unevenly. |
| Testing and surveillance | Lab-confirmed counts tracked spread but missed many mild cases once volume surged. | Flu outbreaks require flexible surveillance that can scale and spot severity signals. |
| Antiviral treatment | Neuraminidase inhibitors were widely used for high-risk patients and severe illness; other antivirals and older agents informed protocols. | Public health emergencies benefit from stockpiles, updated resistance tracking, and simple prescribing guidance. |
| Vaccination campaigns | Pandemic vaccine rollouts, including Pandemrix in some regions, aimed to protect priority groups amid shifting supply. | Manufacturing speed and risk communication shape uptake, even during flu season. |
Long-term Effects on Public Health
After 2009, many countries made influenza surveillance a year-round job. They did more genomic monitoring and faster reporting. They also worked better with hospitals and public health teams.
The pandemic changed how seasonal vaccines are updated and talked about. H1N1 became part of routine vaccines. It showed that pandemics don’t follow a calendar, but flu season planning is important. This keeps pandemic preparedness focused on being adaptable and ready for emergencies.
The Role of Vaccination in Pandemics
Influenza pandemics can move fast, leaving people without immunity. Vaccines are key to fight severe illness from viruses and other respiratory diseases.
Flu vaccines do more than prevent infection. They also lower the risk of pneumonia, hospitalization, and death when the virus spreads fast.
Importance of Flu Vaccines
Most flu vaccines in the U.S. help the body recognize current strains. They usually target two A subtypes and one B strain.
But, new variants can evade old immunity. So, vaccines aim to lessen severe disease in many age groups, mainly in those at high risk.
Historical Vaccination Efforts
Early attempts show timing and matching are key. In 1918, vaccines failed because the virus vanished before they could be made.
In 1947, a 1943 H1N1 vaccine didn’t protect U.S. troops well. This was because the virus had changed a lot.
By 1957, vaccines needed more antigen for a strong response in unprimed populations. Giving doses less than four weeks apart helped early on. But, giving doses in the skin didn’t offer extra benefits.
By 1968, knowing about neuraminidase (NA) immunity helped target vaccines better. An H2N2 vaccine reduced H3N2 infection by 54% in Air Force cadets. This shows how partial immunity can help in pandemics.
| Period | What happened | What it taught vaccine planning | Why it matters for respiratory illnesses |
|---|---|---|---|
| 1918 | Vaccine attempts did not succeed because the virus could not be isolated in time. | Speed and lab readiness shape whether a vaccine can arrive before peak spread. | Delayed tools leave communities exposed to severe viral infections and complications. |
| 1947 | A 1943 H1N1-based vaccine failed to protect U.S. military personnel during a “pseudopandemic.” | Antigenic variation can erase expected protection even with recent vaccination. | Mismatch can raise illness burden and strain care systems during influenza pandemics. |
| 1957 | Unprimed groups needed more antigen; split doses under four weeks improved early response. | Dose and schedule can be as important as the strain choice in a vaccine campaign. | Better early immunity can reduce severe respiratory illnesses while spread is high. |
| 1968 | NA-related immunity supported targeted strategies; an H2N2 adjuvant vaccine reduced later verified H3N2 infection by 54% in Air Force cadets. | Broader immune targets can reduce disease when viruses change. | Less severe disease lowers complications from viral infections, including pneumonia. |
Current Vaccination Challenges
Influenza viruses change quickly, making vaccine updates a must. This is true even when demand for vaccines varies.
These changes make predicting vaccine success hard. Public health focuses on protecting high-risk groups and controlling spread in animals. This helps prevent outbreaks in humans.
Technological Advances in Pandemic Preparedness
New tools have changed how fast we can spot and study influenza threats. Better labs, faster data sharing, and clearer field reporting all help in pandemic preparedness. These gains also sharpen epidemiology during fast-moving outbreaks and other public health emergencies.

Research and Development
Modern virology made it possible to identify pandemic strains quickly in 1957 and 1968. Early work used complement fixation tests to flag influenza A in 1957, then moved to subtype work that defined H2N2. Tracking changes in hemagglutinin and neuraminidase helped labs describe what made each wave distinct.
Over time, evidence supported genetic reassortment with animal influenza A viruses as a key driver of true pandemics with HA subtype change. This insight shaped how infectious diseases are studied across species. Genomic methods also grew more central, and Jeffery Taubenberger’s influenza research is often cited when teams map viral change and plan for future risk.
Role of Health Organizations
Large health systems turn lab signals into shared action. The World Health Organization uses a six-stage pandemic classification that tracks spread from mainly animal infection to sustained human transmission and worldwide reach. That common framework helps align epidemiology methods and planning across borders during public health emergencies.
Coordination also depends on timely reporting. In 1957, WHO organized response steps after being informed through Singapore’s surveillance capacity. In 2009, WHO situation reporting included global case and death tallies, giving decision-makers a steady view of infectious diseases as conditions changed.
Importance of Surveillance Programs
Surveillance is where many warnings begin. In 1957, Singapore served as the only influenza surveillance laboratory in Southeast Asia, showing how a single strong node can speed alerts. Early detection can shorten the time to vaccine updates and other steps tied to pandemic preparedness.
| Surveillance focus | What it tracks | Why it matters for action | Common signal of concern |
|---|---|---|---|
| Sentinel clinic testing | Trends in influenza-like illness and lab-confirmed cases | Guides local response levels during public health emergencies | Sharp jump in positivity and ER visits |
| Virus characterization | Changes in hemagglutinin and neuraminidase | Supports vaccine strain selection and risk assessment | New antigen pattern that reduces immune match |
| Animal reservoir monitoring | Wild birds, domestic poultry, and pigs | Links human epidemiology to cross-species risk pathways | Novel influenza A detected in livestock or birds |
| Travel and trade signals | Passenger flows and commercial shipments of live bird products | Helps predict where infectious diseases may spread next | Clusters near ports, airports, or live-animal markets |
When surveillance includes animal sampling and human movement patterns, it becomes more predictive. Monitoring wild birds, domestic poultry, and pigs adds context for reassortment risk. Watching travel routes and commercial shipments of live bird products can also hint at how fast a strain may propagate.
Social and Economic Effects of Influenza Pandemics
Influenza pandemics do more than strain hospitals. They disrupt work, schooling, and daily routines. This turns ordinary illness into global health crises. During flu season, the pressure often rises fast, as respiratory illnesses spread in tight waves.
In the United States, the 1918 influenza pandemic shows how quickly a surge can reshape city life. Many communities faced sudden public health emergencies. There were shortages of staff, beds, and supplies.
The human toll became visible in crowded wards and overrun burial systems.
Short-term Consequences
In 1918, demand for doctors, nurses, and hospital rooms outpaced supply. Some cities reported severe gaps in basic medical goods, from gauze to oxygen support. Families faced fear and grief at a scale that changed how people moved through public spaces.
Burial capacity broke down in major cities. New York City is reported to have buried about 33,000 victims, while Philadelphia lost nearly 13,000 people in a matter of weeks. In some places, streetcars were used as makeshift hearses when the normal system could not keep up.
Long-term Economic Impact
Economic damage often followed the health shock. Historian Alfred W. Crosby documented how undertakers were overwhelmed and how some prices reportedly jumped by as much as 600%. For households already stretched thin, higher burial fees added another hardship during flu season.
When wage earners fell ill or died, family budgets could collapse overnight. Accounts from the period describe homes where no adult was well enough to cook, shop, or care for children. With respiratory illnesses hitting many people at once, communities saw gaps in food access and basic services.
| Economic pressure point | How it showed up in 1918 | Why it matters in public health emergencies |
|---|---|---|
| Funeral and burial costs | Overloaded undertakers; reports of steep price increases; some families digging graves themselves | Costs can rise fastest where demand spikes and oversight is limited during crisis response |
| Household income | Sick or deceased breadwinners; lost wages; delayed pay for hourly workers | Income loss can reduce access to care and increase risk during global health crises |
| Food and basic needs | Caregivers ill; meals not prepared; shortages tied to labor disruption | Health shocks can become supply shocks when many workers are out at the same time |
| Workforce continuity | Absences across transit, sanitation, and health services | Essential systems become fragile when respiratory illnesses spread in clusters |
Changes in Social Behavior
Behavior changed as cities tried to slow transmission. Boston closed schools and some businesses, Nashville restricted gatherings, and Chicago enforced rules in public spaces, including arrests tied to coughing or sneezing in public. Mask use was also documented in Tokyo, showing that protective habits crossed borders during global health crises.
Wave dynamics made the disruption repeat. The 1918 and 1889–1890 pandemics are often described as unfolding in three or four waves, with increasing lethality in later phases. Within a wave, mortality could be higher early on, which helped drive stricter rules and sharper public anxiety during flu season.
Lessons Learned from Past Pandemics
Looking back, we see that each pandemic moves at its own pace. Waves can be uneven, and early signs can be misleading. This history helps us prepare better for today’s emergencies.
Good planning is based on science, not guesses. Animals like pigs and poultry can start outbreaks. Wild birds can spread new strains far and wide. Fast travel turns local outbreaks into big problems quickly.
Preparedness Strategies
Flexible plans are better than fixed ones. We need stockpiles, more staff, and clear rules for schools and work. This way, we can adjust as needed.
Medical lessons are also key. In 1918, secondary infections killed many. Today, we know antibiotics are vital. We also use antivirals like oseltamivir, zanamivir, peramivir, laninamivir, and baloxavir marboxil to fight the virus.
| Lesson from influenza pandemics | What it changes in readiness | Why it matters for public health emergencies |
|---|---|---|
| Waves can arrive in bursts with uneven intensity | Plan for phased staffing, rotating shifts, and reopening reversals | Hospitals can face repeated surges, not one peak |
| Animal reservoirs can seed novel strains | Support monitoring in pigs, chickens, ducks, and wild birds | Earlier detection can shorten the time to response actions |
| Complications may be bacterial or viral | Pair antibiotic stewardship with antiviral deployment plans | Treatment pathways need options when disease patterns vary |
| Modern travel speeds up spread | Coordinate airport, workplace, and community guidance | Delays in messaging can widen transmission windows |
Communication and Public Trust
In 1918, public trust was broken when words didn’t match reality. Clear language helps, and so does explaining changes. Trust grows when we share what we know and what we don’t.
Misinformation spreads when we’re silent. Updates, clear spokespeople, and simple actions help. Strong epidemiology teams support this with clear trends and explanations.
Importance of Global Cooperation
Influenza pandemics don’t respect borders. Shared systems are key. The World Health Organization’s role and its pandemic staging approach help countries work together.
Past limits on sharing information slowed us down. Better data sharing and connected systems improve our readiness. In emergencies, speed and transparency are key to a good response.
Future of Influenza Pandemics
The next wave of flu pandemics might be different from the last. Health agencies are watching for changes in how flu spreads and who gets sick. This helps them prepare hospitals, schools, and workplaces for future outbreaks.
Predicting Future Outbreaks
It’s hard to predict when big outbreaks will happen. A big sign is when the flu virus changes a lot. This can happen when human and animal viruses mix.
Animal outbreaks keep health officials on alert. They watch for avian flu A(H5N1) because it could cause a big outbreak. They also remember outbreaks in India and the U.S. in 2006 and 2007.
When people and animals are close, the risk of flu spreading grows. Bird migration and travel can help viruses spread. This makes planning for outbreaks tricky.
Innovations in Treatment and Vaccination
Today, we have more ways to fight the flu than before. We have new medicines like Tamiflu and Relenza. Older medicines like Flumadine are also used, but only if the virus hasn’t changed too much.
Vaccines are also getting better. We have inactivated and live vaccines to fight the flu. The goal is to make vaccines faster and easier to get during outbreaks.
| Approach | What it targets | Where it fits in care | Key constraint |
|---|---|---|---|
| Antivirals (e.g., Tamiflu, Relenza, baloxavir marboxil) | Viral replication inside the body | Early treatment and some prevention in high-risk settings | Timing and resistance patterns can limit benefit |
| Inactivated vaccines | Immune response to circulating strains | Broad use in seasonal programs and surge planning | Needs updates when strains change |
| Live attenuated vaccines | Immune training using a weakened virus | Selected groups based on age and health status | Not recommended for everyone |
| Surveillance and lab sequencing | Early detection of new variants | Guides vaccine composition and outbreak response | Coverage gaps can slow recognition |
Role of Climate Change in Pandemic Risk
Climate change can change how animals live. This can affect how flu spreads. If birds migrate differently, it could change where flu spreads.
Preparing for pandemics means being flexible. Plans need to adjust to changing seasons and new places where flu spreads. This way, we can better fight infectious diseases.
Conclusion
Influenza Pandemics are not just bad flu seasons. They start when a new flu strain emerges and spreads quickly. This is because most people have little immunity.
Many of these strains come from animals and can infect humans. They then spread through travel and close contact. This is why global health crises tied to respiratory illnesses can happen in weeks, not years.
Summary of Key Points
The past century has seen many outcomes. The 1918 H1N1 pandemic was the worst, with 50–100 million deaths worldwide. About 675,000 died in the United States.
The 1957 H2N2 and 1968 H3N2 pandemics each caused 1–4 million deaths. The 2009 H1N1 pandemic was milder but widespread, with 151,700–575,400 deaths. These show how fast a new strain can change our lives.
The Importance of Ongoing Research
Ongoing research in virology and epidemiology helps us understand why viruses change. Scientists track how viruses evolve and how risk grows. They look at antigenic drift and shift, and reassortment that creates new combinations.
H3N2 is a major seasonal threat, putting pressure on hospitals every winter. Surveillance labs and the World Health Organization’s reporting help spot dangers early. This speeds up the response.
Call to Action for Public Health Awareness
In the United States, awareness is key because flu can spread too fast. Know the difference between flu and the common cold. Watch for severe signs like trouble breathing or dehydration.
Support vaccination strategies, focusing on older adults, young children, pregnant people, and those with chronic conditions. During emergencies, follow evidence-based guidance. This helps communities fight the next wave of respiratory illnesses.
FAQ
What is influenza (the flu)?
What is an influenza pandemic?
Why do influenza pandemics matter for societies and governments?
How often do influenza pandemics happen?
What causes influenza pandemics to start?
How does influenza spread between people and from animals?
How long can influenza viruses remain infectious outside the body?
What are the major influenza pandemics in history?
How severe was the 1918 Spanish flu compared with later pandemics?
What makes the 2009 H1N1 pandemic “relatively mild” in historical terms?
What do R0 and case fatality rate (CFR) tell us about pandemics?
Did the 1918 pandemic have signs of an early U.S. outbreak?
What symptoms and complications made the 1918 flu so deadly?
Who was most at risk during the 1918 pandemic?
How did the Spanish flu disrupt the U.S. economy and daily life?
What public health measures were used in 1918?
Was there a flu vaccine in 1918?
What was the 1957 Asian flu, and where did it begin?
How many people died in the 1957 pandemic, including in the United States?
How did antibiotics change outcomes after 1918?
What was the 1968 Hong Kong flu, and why did scientists focus on N2 immunity?
How did the 1968 pandemic affect regions differently?
What happened during the 2009 H1N1 “swine flu” pandemic?
What are “waves,” and why do they matter in pandemic planning?
What were “not true pandemics,” and why does that distinction matter?
How do influenza viruses change enough to cause pandemics?
What antivirals are used for influenza treatment and pandemic mitigation today?
What is a flu vaccine, and why is vaccination central during pandemics?
What did the 1947 vaccine mismatch teach public health?
What did the 1957 pandemic teach researchers about dosing and immune response?
What role did WHO play in pandemic response and classification?
Why are influenza surveillance programs so important?
What does pandemic preparedness look like today?
How do pandemics change policy in the United States and globally?
How does climate change relate to influenza pandemic risk?
Which avian influenza strains are watched for pandemic risk?
How can individuals tell influenza apart from a common cold, and when should they seek urgent care?
What should the public do during flu season and during major flu outbreaks?
Get More Medical History
Join our newsletter for fascinating stories from medical history delivered to your inbox weekly.